 01
01Capture the signals that matter
Data collection across operations
Stop chasing updates across teams. We capture your transport, inventory and service data in one place, giving you a clear view that reflects your day-to-day operations.
When your supply chain spans multiple sites and carriers, it’s easy to lose track. We turn your daily data into reliable reports, so you can monitor performance and stay in control. The result? Faster decisions and a supply chain that scales easily as you grow.

Most supply chains aren't short on data. It’s simply buried in a messy, scattered form. A late inbound delivery leads to a stockout, a picking error drives up returns, and by the time you see the monthly report, it’s too late to act. We close that gap with structured reporting built around how your operation actually runs. You get one clear view of your inventory, orders and transport. This helps you spot bottlenecks early, track trends with confidence and make decisions that work in the real world. If you want tighter control, start with data you can trust. That’s how you keep your supply chain performing consistently, even when the unexpected happens.

Stop piecing together updates from multiple tools. You need clear views of the right data at the right time. Our logistics dashboards bring your operational data into one place, empowering your team to monitor performance and resolve exceptions faster.
We tailor reporting to your specific flow and priorities. You get insights that reflect reality, so you can make faster, bolder decisions.
Track inventory, orders and transport in real time. You’ll see every move, so you can react fast and stay in control when plans change.
Use reporting to sharpen your inventory and spot trends early. It’s the data you need for smarter daily moves and better future planning.
Track KPIs in one place, spot bottlenecks early and keep your improvement efforts focused on the operations that make a real difference.
Good decisions need more than a gut feeling. Our structured reporting delivers a clear view of what’s happening across your supply chain. Skip the debates about data and focus on fixing the issues that affect service levels and costs.
01Capture the signals that matter
Stop chasing updates across teams. We capture your transport, inventory and service data in one place, giving you a clear view that reflects your day-to-day operations.
 02
02Make it consistent and reliable
We align data with your systems and operational setup, so reporting stays accurate. We remove the noise and manual clean-up to give your teams a dependable base for analysis.
 03
03See performance at a glance
We turn your data into clear reports focused on the metrics you care about. Track inventory and performance at a glance, then dive into the details whenever something needs your attention.
 04
04Understand trends and root causes
Structured reporting helps you spot patterns early and understand what drives results. It turns data into a practical tool you can use every day, rather than a monthly document that arrives too late to make a difference.
 05
05Turn insight into better operations
Seeing what is happening lets you control what happens next. Use data to refine inventory, smooth handovers and sharpen monitoring. We’ll keep your supply chain moving in the right direction.
Klairy brings your transport, inventory and service operations into one clear view. No more piecing reports together. With Microsoft Power BI, you get interactive dashboards to track real performance, spot trends and resolve issues before they affect your results.

Maya is the in-house warehouse management system (WMS) used in our automated operations. It gives you clear dashboards and tailored reporting on order processing, stock levels, sales trends and shipment performance, so you can stay on top of daily fulfilment and act quickly when demand shifts.

You might be running B2B distribution, service parts logistics or a subscription model with tight cut-off times and high expectations. Paxon adapts reporting to your processes and the KPIs that matter most to your business, giving your teams the insights they need to improve performance with confidence.
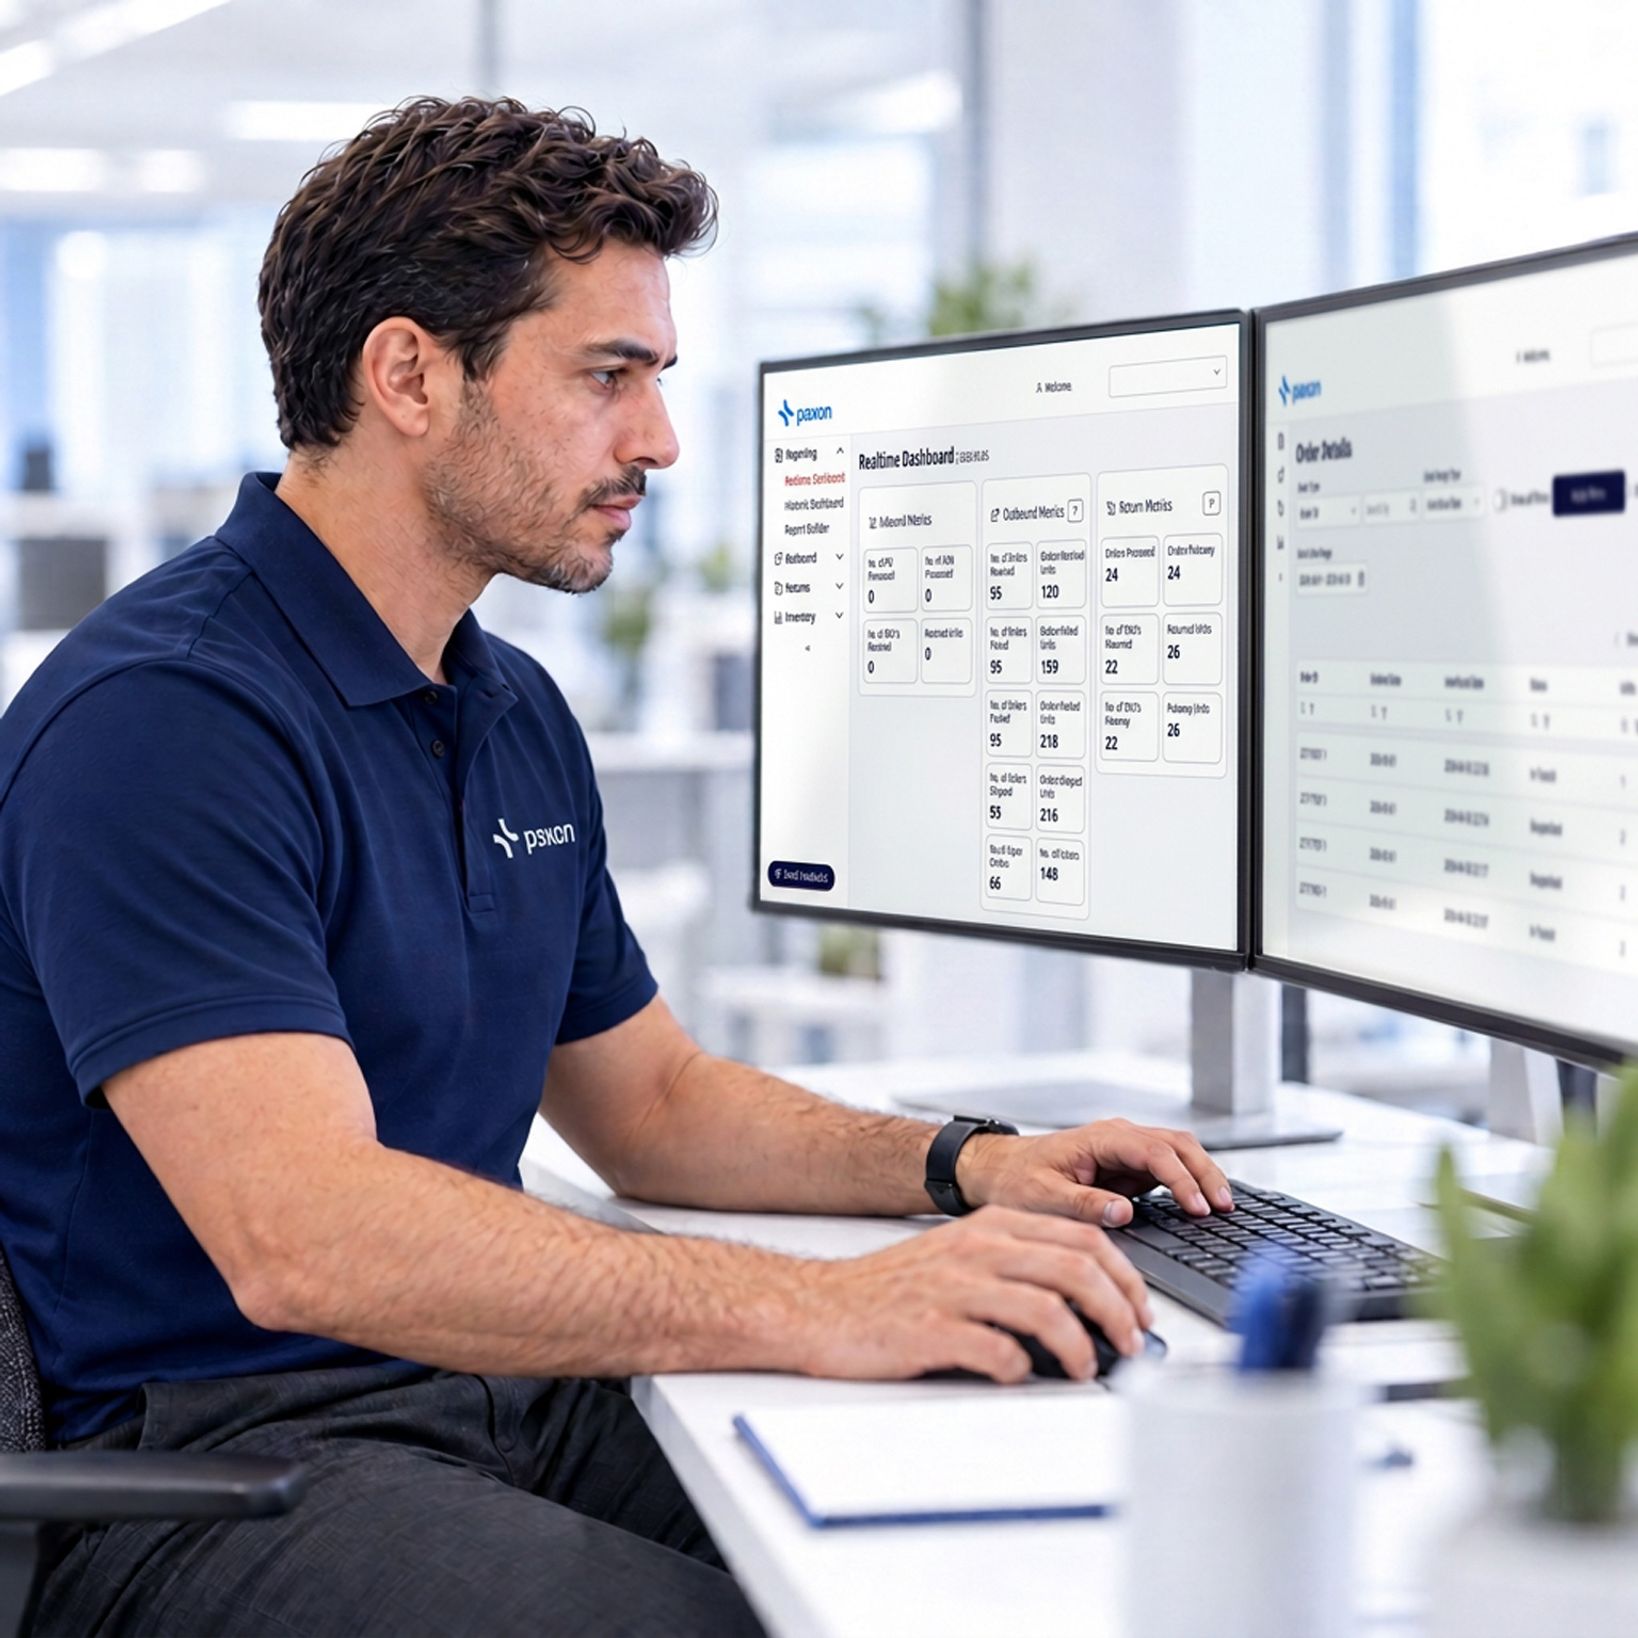

When your data is scattered, decisions stall. Operations and finance see different numbers, and meetings focus on reconciling data instead of solving problems. We bring logistics reporting back to reality: a shared view of inventory, orders and transport. With real-time visibility, your teams stop building reports and start acting on them. Spot bottlenecks early, keep service levels on track and pivot fast when priorities shift. These insight connect directly to execution, so your improvements stick.
If you’re trying to run a tighter operation, you don’t need more data. You need reporting you can trust, built around how your supply chain actually works. Here are the questions we hear most from supply chain and operations teams.
It means your reporting is built on consistent definitions and data sources, so the numbers don’t change depending on who pulled the report. Paxon sets reporting up around your operational reality, then keeps it consistent across transport, warehousing, and service flows. You get one version of the truth you can actually run the business on.
You can track the operational areas that drive service and cost: delivery performance, inventory status, service levels, and operational efficiency. The point isn’t to flood you with dashboards. It’s to give you the specific views that help your team spot bottlenecks, understand trends, and act before small issues become big ones.
Both, depending on what you need. Data is continuously updated so you can see what’s happening across inventory, orders, transport, and service flows as it unfolds. And you still get structured reporting that supports weekly and monthly performance reviews, budget control, and longer-term planning.
Paxon works with multiple logistics applications across the organisation, configured to capture the right operational data for each flow and model. We bring that data into a clear, consistent view, which reduces manual reporting and stops teams from reconciling spreadsheets just to answer basic performance questions.
When reporting reflects what’s actually happening on the floor and in transport, you can monitor performance consistently, spot patterns early, and measure the impact of changes.
Klairy is the platform used within Paxon Service Parts Logistics, Paxon Freight Management, and logistics for life sciences and health as the foundation for data analytics in complex logistics environments. It connects transport, inventory, and service operations into one structured system so data is captured and aligned. Reporting in Klairy is supported by Microsoft Power BI, giving you interactive dashboards and clear visualisations tied to operational performance.
Maya is the in-house warehouse management system (WMS) used within Paxon's automated operations to support real-time visibility across B2C fulfilment operations. It gives insight into order processing, stock levels, sales data, and shipment performance, so you can monitor what’s happening in your webshop operation with more clarity and less guesswork.
Stop debating spreadsheets and start solving issues. We provide clear, reliable reporting that reflects your real operations. Spot risks early and align your team faster to keep performance on track.